0%
0 / 2 answered
Line Graphs Practice Test
•2 QuestionsQuestion
1 / 2
Q1
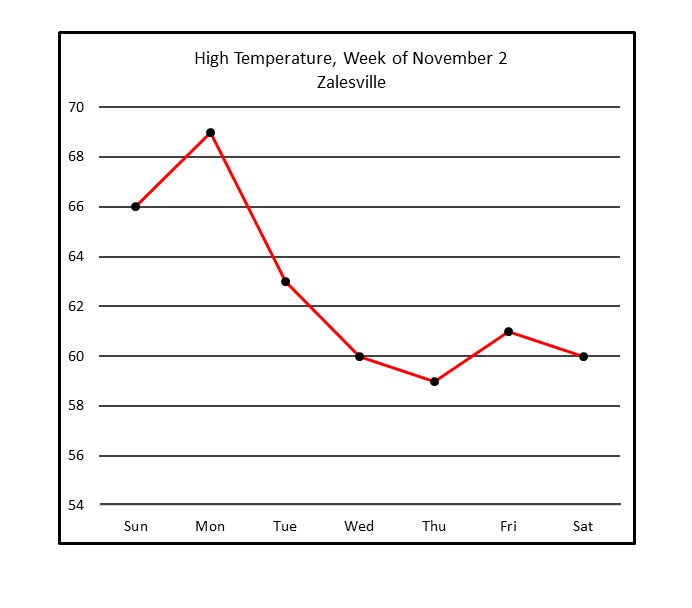
Refer to the above line graph, which tracks the high temperature in a town over one calendar week.
Of the days shown, between which two consecutive days did the peak temperature decrease the most?
Refer to the above line graph, which tracks the high temperature in a town over one calendar week.
Of the days shown, between which two consecutive days did the peak temperature decrease the most?