How to do logarithmic transformations
AP Statistics · Learn by Concept
Help Questions
AP Statistics › How to do logarithmic transformations
1 - 2
1
What transformation should be done to the data set, with its residual shown below, to linearize the data?
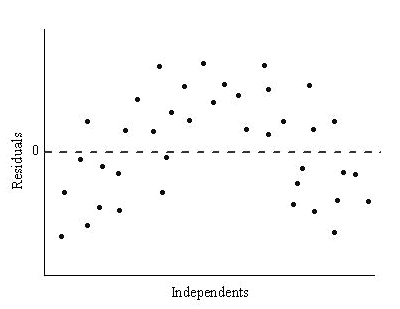
take the log of the dependent variable
CORRECT
multiply the dependent variable by a constant k.
Add 
multiply the independent variable by

Nothing, the data set is already linear
Explanation
Taking the log of a data set whose residual is nonrandom is effective in increasing the correleation coefficient and results in a more linear relationship.
2
CORRECT
0