Inference - AP Statistics
Card 1 of 256
In a recent academic study, your lab partner told you that they rejected the null hypothesis that the ionization of water has no effect on the rate of grass growth.
If the null hypothesis was actually valid, what type of error was made?
In a recent academic study, your lab partner told you that they rejected the null hypothesis that the ionization of water has no effect on the rate of grass growth.
If the null hypothesis was actually valid, what type of error was made?
Tap to reveal answer
A type I error occurs when the null hypothesis is valid but rejected.
A type II error occurs when the null hypothesis is false, but fails to be rejected.
Because the null hypothesis was true, but rejected, they made a Type I error.
A type I error occurs when the null hypothesis is valid but rejected.
A type II error occurs when the null hypothesis is false, but fails to be rejected.
Because the null hypothesis was true, but rejected, they made a Type I error.
← Didn't Know|Knew It →
A company claims that they have 12 ounces of potato chips in each of their bags of chips. A customer complaint is filed that they do not truly contain 12 ounces but actually contain less. A sampling test is conducted to see if the comapny measure is true or not. What would be an example of a Type I error?
A company claims that they have 12 ounces of potato chips in each of their bags of chips. A customer complaint is filed that they do not truly contain 12 ounces but actually contain less. A sampling test is conducted to see if the comapny measure is true or not. What would be an example of a Type I error?
Tap to reveal answer
The type I error is rejecting the null hypothesis when it is actually true. The null here is 12 ounces per bag so a type I error would be rejecting the company claim even though there are 12 ounces per bag.
The type I error is rejecting the null hypothesis when it is actually true. The null here is 12 ounces per bag so a type I error would be rejecting the company claim even though there are 12 ounces per bag.
← Didn't Know|Knew It →
A researcher stated that  percent of Americans in the 2008 presidential election were liberal. The researcher wants to find evidence that the percent of liberal Americans was different for the 2012 presidential election. Which of the hypotheses best describes the question that the researcher is trying to answer?
A researcher stated that
Tap to reveal answer
The question states that the researcher thinks the percent of liberal Americans in 2012 is different than the  percent in 2008. The hypothesis is 2 directional. Therefore the null hypothesis is
  and the alternative is
  .
.
The question states that the researcher thinks the percent of liberal Americans in 2012 is different than the
← Didn't Know|Knew It →
We are comparing the Democratic percentage of Detroit to the Democratic percentage of Dallas.
In Detroit, we sampled 300 people and 208 were Democrats (.693)
In Dallas, we sampled 350 people and 265 were Democrats (.757)
What is the p-value for the .064 difference?
(Assume a 2-tailed test.)
We are comparing the Democratic percentage of Detroit to the Democratic percentage of Dallas.
In Detroit, we sampled 300 people and 208 were Democrats (.693)
In Dallas, we sampled 350 people and 265 were Democrats (.757)
What is the p-value for the .064 difference?
(Assume a 2-tailed test.)
Tap to reveal answer
Overall percentage = /(300+350) = .728")
*(.272)*(1/300 + 1/350)} = .035")


.0344 is for one tail, so .0688 is for both tails.
(Percentages are different at the .9312 level.)
Overall percentage =
.0344 is for one tail, so .0688 is for both tails.
(Percentages are different at the .9312 level.)
← Didn't Know|Knew It →
Tap to reveal answer
No explanation available
No explanation available
← Didn't Know|Knew It →
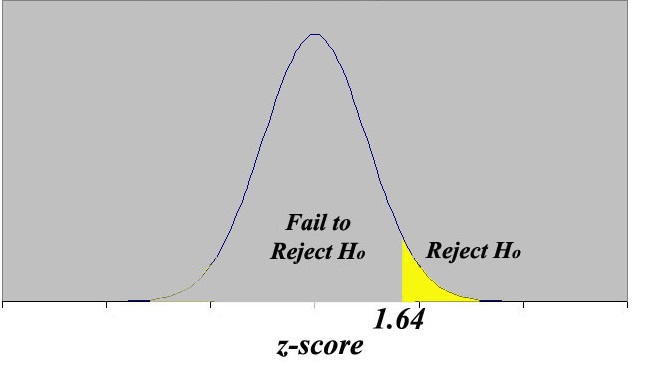
Suppose you conduct a paired  -test to assess whether two group means significantly differ and find a
  -score of 1.645. At what alpha level would this cause you to reject the null?
Suppose you conduct a paired
Tap to reveal answer
The critical value for a  -test with alpha set to 0.10 is 1.645.
The critical value for a
← Didn't Know|Knew It →
Bob wants to statistically determine if the mean height of middle school boys is greater than the mean height of middle school girls. He wants to use a significance level of  What must be true for him to reject
  .
.  is known.
Bob wants to statistically determine if the mean height of middle school boys is greater than the mean height of middle school girls. He wants to use a significance level of
Tap to reveal answer
Step 1: We need to use a 2-sample z test because there are 2 samples, boys and girls. The population standard deviation,  , is known, so we can assume a standard distribution for each sample.
Step 2: This is a one-sided z test because the questions asks if the mean height of boys is greater than the mean height of girls.


Step 3: significance level, or alpha, is  . This means we need a p-value less than
  in order to reject the null hypothesis
  . A z-score greater than
  would ensure a p-value less than
  .
.
Step 1: We need to use a 2-sample z test because there are 2 samples, boys and girls. The population standard deviation,
Step 2: This is a one-sided z test because the questions asks if the mean height of boys is greater than the mean height of girls.
Step 3: significance level, or alpha, is
← Didn't Know|Knew It →
Tap to reveal answer
No explanation available
No explanation available
← Didn't Know|Knew It →
A statistician conducts a regression analysis and obtains a p-value of 0.1. It is more likely than not that there is a relationship between the variables in the study.
A statistician conducts a regression analysis and obtains a p-value of 0.1. It is more likely than not that there is a relationship between the variables in the study.
Tap to reveal answer
A p-value of 0.1 is generally not sufficient to reject the null hypothesis, but this is only because we want a high degree of confidence before finding a relationship between variables. Here, there is most likely a relationship between the variables even though the statistician could not reject the null hypothesis.
A p-value of 0.1 is generally not sufficient to reject the null hypothesis, but this is only because we want a high degree of confidence before finding a relationship between variables. Here, there is most likely a relationship between the variables even though the statistician could not reject the null hypothesis.
← Didn't Know|Knew It →
Which of the following is an incorrect condition requirement for regression inference?
Which of the following is an incorrect condition requirement for regression inference?
Tap to reveal answer
All of the following choices are correct conditions except for the choice concerning a trend/pattern of some sort in the residual plot. For regression inference to be accurate, we need to look at the residual plot of the data of interest and make sure there is random scatter. Random scatter indicates that the ordered pairs are indeed independent of each other. Any sort of pattern present in the residual plot would not satisfy that requirement, and therefore would not enable us to successfully use regression inference.
All of the following choices are correct conditions except for the choice concerning a trend/pattern of some sort in the residual plot. For regression inference to be accurate, we need to look at the residual plot of the data of interest and make sure there is random scatter. Random scatter indicates that the ordered pairs are indeed independent of each other. Any sort of pattern present in the residual plot would not satisfy that requirement, and therefore would not enable us to successfully use regression inference.
← Didn't Know|Knew It →
For a data set, the least-squares regression line has a  confidence interval for the slope of
 ") .
.
Based on this confidence interval, what can you do with a hypothesis test at  significance level where
  and
and  ?
?
For a data set, the least-squares regression line has a
Based on this confidence interval, what can you do with a hypothesis test at
Tap to reveal answer
Notice that the interval does not include  . This means that the P-value for the hypothesis test would be under 5%, which would lead us to reject our null hypothesis.
Any confidence interval can be used to create a hypothesis test by inverting it, and it is fairly simple, but the concept is tested into graduate-level statistics theory.
Notice that the interval does not include
Any confidence interval can be used to create a hypothesis test by inverting it, and it is fairly simple, but the concept is tested into graduate-level statistics theory.
← Didn't Know|Knew It →
A prominent football coach is being reviewed for his performance in the past season. To evaluate how well the coach has done, the team manager runs a statistical test comparing the coach to a sample of coaches in the league. If the test suggests that the coach outperformed other coaches when in fact he did not, and the manager then rejects the null hypothesis (that the coach did not outperform the other coaches), what kind of error is he committing?
A prominent football coach is being reviewed for his performance in the past season. To evaluate how well the coach has done, the team manager runs a statistical test comparing the coach to a sample of coaches in the league. If the test suggests that the coach outperformed other coaches when in fact he did not, and the manager then rejects the null hypothesis (that the coach did not outperform the other coaches), what kind of error is he committing?
Tap to reveal answer
A type I error occurs when one rejects a null hypothesis that is in fact true. The null hypothesis is that the coach does not outperform other coaches, and the test reccomends that we reject it even though it is true. Thus, a type I error has been committed.
A type I error occurs when one rejects a null hypothesis that is in fact true. The null hypothesis is that the coach does not outperform other coaches, and the test reccomends that we reject it even though it is true. Thus, a type I error has been committed.
← Didn't Know|Knew It →
If a hypothesis test uses a  confidence level, then what is its probability of Type I Error?
If a hypothesis test uses a
Tap to reveal answer
By definition, the probability of Type I Error is,
=1-C")
where,
") represents Probability of Type I Error and
represents Probability of Type I Error and  represents the confidence level.
Thus resulting in:
=1-.95=0.05")
By definition, the probability of Type I Error is,
where,
Thus resulting in:
← Didn't Know|Knew It →
For significance tests, which of the following is an incorrect way to increase power (the probability of correctly rejecting the null hypothesis)?
For significance tests, which of the following is an incorrect way to increase power (the probability of correctly rejecting the null hypothesis)?
Tap to reveal answer
Recall that power is ") . The probability of Type I and Type II errors will change inversely of each other as the probability of making a Type I error changes. If
. The probability of Type I and Type II errors will change inversely of each other as the probability of making a Type I error changes. If ") increases, then
increases, then ") decreases, and as a result power will increase. So if
decreases, and as a result power will increase. So if ") decreases,
decreases, ") would increase, and power would decrease; therefore decreasing
would increase, and power would decrease; therefore decreasing ") will not increase power.
will not increase power.
Recall that power is
← Didn't Know|Knew It →
In a recent athletic study, your lab partner told you that they rejected the null hypothesis that the fabric of running shoes has no effect on the wearer's running times.
If the null hypothesis was actually valid, what type of error was made?
In a recent athletic study, your lab partner told you that they rejected the null hypothesis that the fabric of running shoes has no effect on the wearer's running times.
If the null hypothesis was actually valid, what type of error was made?
Tap to reveal answer
A type I error occurs when the null hypothesis is valid but rejected.
A type II error occurs when the null hypothesis is false, but fails to be rejected.
Because the null hypothesis was true, but rejected, they made a Type I error.
A type I error occurs when the null hypothesis is valid but rejected.
A type II error occurs when the null hypothesis is false, but fails to be rejected.
Because the null hypothesis was true, but rejected, they made a Type I error.
← Didn't Know|Knew It →
If a test has a power of  , what is the probability of Type II error?
If a test has a power of
Tap to reveal answer
From the statistical definition of power (of a test), the power is equal to  where
where  represents the Type II error.
Therefore our equation to solve becomes:


From the statistical definition of power (of a test), the power is equal to
Therefore our equation to solve becomes:
← Didn't Know|Knew It →
You and a classmate wanted to test the effect of sugars and fats on levels of blood sugar.
Your classmate told you that they found the null hypothesis valid, which was what there is no difference between the effects of sugars and fats on blood sugar levels.
If the null hypothesis was actually false, what type of error was made?
Tap to reveal answer
A type I error occurs when the null hypothesis is valid but rejected.
A type II error occurs when the null hypothesis is false, but fails to be rejected.
Because the null hypothesis was false, but had failed to be rejected, they made a Type II error.
A type I error occurs when the null hypothesis is valid but rejected.
A type II error occurs when the null hypothesis is false, but fails to be rejected.
Because the null hypothesis was false, but had failed to be rejected, they made a Type II error.
← Didn't Know|Knew It →
You and a friend wanted to test the effect of similar servings of juice and soda on blood sugar levels.
Your friend told you that they found the null hypothesis valid, which was what there is no difference between the effects of similar servings of juice and soda on blood sugar levels.
If the null hypothesis was actually false, what type of error was made?
Tap to reveal answer
A type I error occurs when the null hypothesis is valid but rejected.
A type II error occurs when the null hypothesis is false, but fails to be rejected.
Because the null hypothesis was false, but had failed to be rejected, they made a Type II error.
A type I error occurs when the null hypothesis is valid but rejected.
A type II error occurs when the null hypothesis is false, but fails to be rejected.
Because the null hypothesis was false, but had failed to be rejected, they made a Type II error.
← Didn't Know|Knew It →
A factory claims that only 1% of their widgets are defective but a large amount of their produced widgets have been breaking for customers. A test is conducted to figure out if the factory claim of 1% defective is true or if the customers claim of graeater than 1% is true. What would be an example of a Type II error?
A factory claims that only 1% of their widgets are defective but a large amount of their produced widgets have been breaking for customers. A test is conducted to figure out if the factory claim of 1% defective is true or if the customers claim of graeater than 1% is true. What would be an example of a Type II error?
Tap to reveal answer
Type II Error is not rejecting a truly false null hypothesis. This means that the test supports the factory claim of 1% even though the true amount is more than that.
Type II Error is not rejecting a truly false null hypothesis. This means that the test supports the factory claim of 1% even though the true amount is more than that.
← Didn't Know|Knew It →
A pretzel company advertises that their pretzels contain less than 1.0g of of sodium per serving. You take a simple random sample of 10 pretzel servings, and calculate that the mean amount of sodium is 1.20 g, with a standard deviation of 0.1 g.
At the 95% confidence level, does your sample suggest that the pretzels actually have higher than 1.0g of sodium per serving?
Tap to reveal answer
This is a one- tailed t-test. It is one-tailed because the question asks whether the pretzel's mean is actually higher, so we are only interested in the right hand tail. We will be using the t-distribution because the population standard deviation is not known.
First we write our hypotheses:


Now we need the appropriate formula for a t-test. We will be using standard error because we are working with the standard deviation of a sampling distribution.

Now we fill in the values from our problem


Now we must look up the t-critical value, or use technology to find the p-value.
We must find the t-critcal value by finding 
} ; t= 1.833")
Because our test statistic 6.32 is more extreme than our critical value, we reject our null hypothesis and conclude that the pretzels do have a higher mean than 1.0.
If you calculated a p-value using technology, p=0.00006884.
Because  , we reject our null hypothesis and conclude that the pretzels do have a higher mean than 1.0 g.
This is a one- tailed t-test. It is one-tailed because the question asks whether the pretzel's mean is actually higher, so we are only interested in the right hand tail. We will be using the t-distribution because the population standard deviation is not known.
First we write our hypotheses:
Now we need the appropriate formula for a t-test. We will be using standard error because we are working with the standard deviation of a sampling distribution.
Now we fill in the values from our problem
Now we must look up the t-critical value, or use technology to find the p-value.
We must find the t-critcal value by finding
Because our test statistic 6.32 is more extreme than our critical value, we reject our null hypothesis and conclude that the pretzels do have a higher mean than 1.0.
If you calculated a p-value using technology, p=0.00006884.
Because
← Didn't Know|Knew It →