Functions, Graphs, and Limits - AP Calculus BC
Card 1 of 1344

\end{align*}")
Tap to reveal answer
\text{ is most likely }0\end{align*}")
← Didn't Know|Knew It →

Given the graph of ") above, what is
above, what is ") ?
?
Given the graph of
Tap to reveal answer
Examining the graph of the function above, we need to look at three things:
-
What is the limit of the function as it approaches zero from the left?
-
What is the limit of the function as it approaches zero from the right?
-
What is the function value at zero and is it equal to the first two statements?
If we look at the graph we see that as  approaches zero from the left the
  values approach zero as well. This is also true if we look the values as
  approaches zero from the right. Lastly we look at the function value at zero which in this case is also zero.
Therefore, we can observe that =0") as
as  approaches
  .
.
Examining the graph of the function above, we need to look at three things:
-
What is the limit of the function as it approaches zero from the left?
-
What is the limit of the function as it approaches zero from the right?
-
What is the function value at zero and is it equal to the first two statements?
If we look at the graph we see that as
Therefore, we can observe that
← Didn't Know|Knew It →

Given the graph of ") above, what is
above, what is ") ?
?
Given the graph of
Tap to reveal answer
Examining the graph above, we need to look at three things:
-
What is the limit of the function as  approaches zero from the left?
-
What is the limit of the function as  approaches zero from the right?
-
What is the function value as  and is it the same as the result from statement one and two?
Therefore, we can determine that ") does not exist, since
does not exist, since  approaches two different limits from either side :
  from the left and
  from the right.
Examining the graph above, we need to look at three things:
-
What is the limit of the function as
-
What is the limit of the function as
-
What is the function value as
Therefore, we can determine that
← Didn't Know|Knew It →

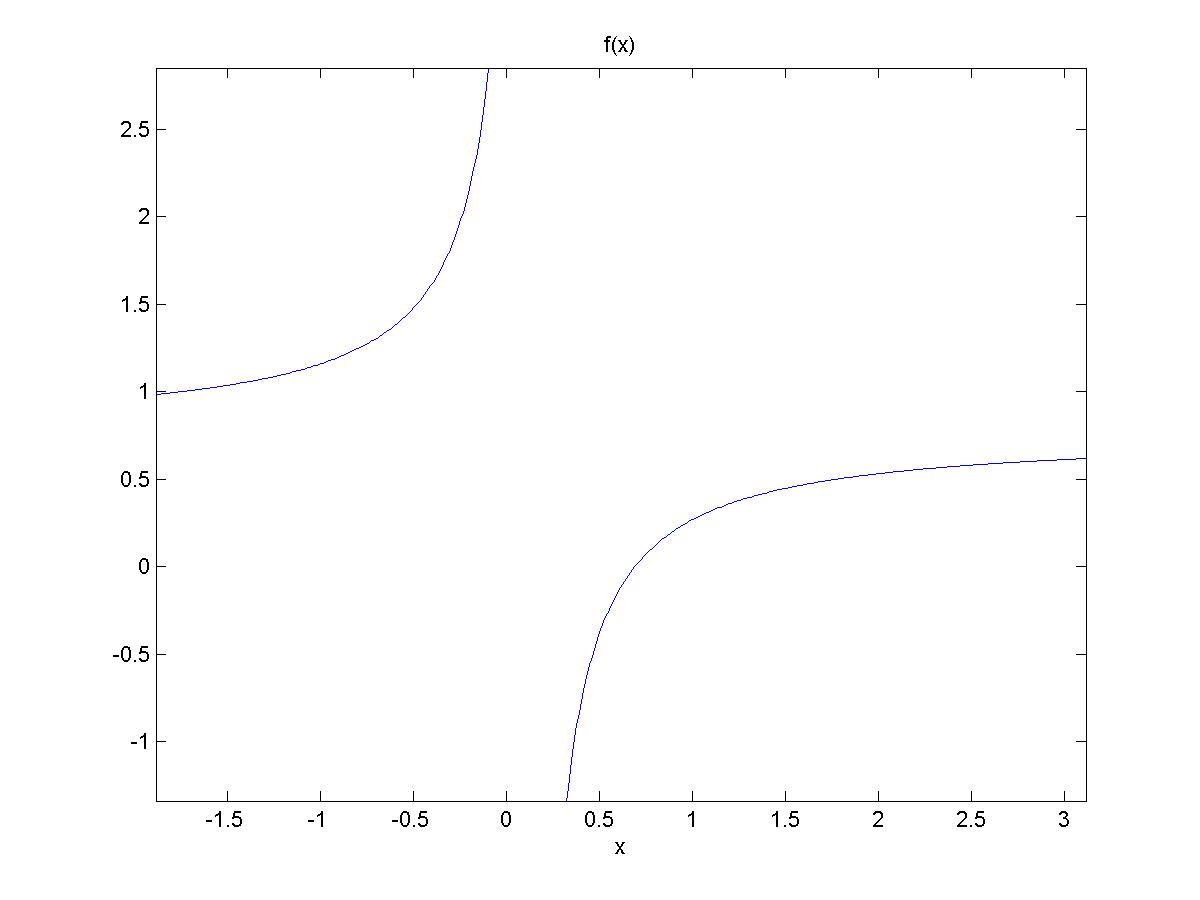
Given the above graph of ") , what is
, what is ") ?
?
Given the above graph of
Tap to reveal answer
Examining the graph, we want to find where the graph tends to as it approaches zero from the right hand side. We can see that there appears to be a vertical asymptote at zero. As the x values approach zero from the right the function values of the graph tend towards positive infinity.
Therefore, we can observe that =\infty") as
as  approaches
  from the right.
Examining the graph, we want to find where the graph tends to as it approaches zero from the right hand side. We can see that there appears to be a vertical asymptote at zero. As the x values approach zero from the right the function values of the graph tend towards positive infinity.
Therefore, we can observe that
← Didn't Know|Knew It →

Given the above graph of ") , what is
, what is ") ?
?
Given the above graph of
Tap to reveal answer
Examining the graph, we can observe that ") does not exist, as
does not exist, as ") is not continuous at
is not continuous at  . We can see this by checking the three conditions for which a function
 ") is continuous at a point
is continuous at a point )") :
:
- A value
") exists in the domain of
exists in the domain of 
- The limit of
") exists as
exists as  approaches
- The limit of
") at
at  is equal to
 ")
Given  , we can see that condition #1 is not satisfied because the graph has a vertical asymptote instead of only one value for
 ") and is therefore an infinite discontinuity at
and is therefore an infinite discontinuity at )") .
.
We can also see that condition #2 is not satisfied because ") approaches two different limits:
approaches two different limits: from the left and
  from the right.
Based on the above, condition #3 is also not satisfied because ") is not equal to the multiple values of
is not equal to the multiple values of ") .
.
Thus, ") does not exist.
does not exist.
Examining the graph, we can observe that
- A value
- The limit of
- The limit of
Given
We can also see that condition #2 is not satisfied because
Based on the above, condition #3 is also not satisfied because
Thus,
← Didn't Know|Knew It →

\&\text{Based on the graph?}\end{align*}")
Tap to reveal answer
\text{ is most likely }\text{Nonexistent.}\end{align*}")
← Didn't Know|Knew It →

\&\text{Based on the graph?}\end{align*}")
Tap to reveal answer
\text{ is most likely }0\end{align*}")
← Didn't Know|Knew It →

 at}\&x=\infty\end{align*}")
Tap to reveal answer
\text{ is most likely }-5\end{align*}")
← Didn't Know|Knew It →

 at}\&x=\infty\end{align*}")
Tap to reveal answer
\text{ is most likely }-\infty\end{align*}")
← Didn't Know|Knew It →

\end{align*}")
Tap to reveal answer
\text{ is most likely }\text{Nonexistent.}\end{align*}")
← Didn't Know|Knew It →

\&\text{Based on the graph?}\end{align*}")
Tap to reveal answer
\text{ is most likely }\infty\end{align*}")
← Didn't Know|Knew It →

 at}\&x=\infty\end{align*}")
Tap to reveal answer
\text{ is most likely }\text{Nonexistent.}\end{align*}")
← Didn't Know|Knew It →

\&\text{Based on the graph?}\end{align*}")
Tap to reveal answer
\text{ is most likely }\text{Nonexistent.}\end{align*}")
← Didn't Know|Knew It →

\&\text{Based on the graph?}\end{align*}")
Tap to reveal answer
\text{ is most likely }0\end{align*}")
← Didn't Know|Knew It →

\&\text{Based on the graph?}\end{align*}")
Tap to reveal answer
\text{ is most likely }\frac{1}{4}\end{align*}")
← Didn't Know|Knew It →

 at}\&x=\infty\end{align*}")
Tap to reveal answer
\text{ is most likely }-\frac{1331}{512}\end{align*}")
← Didn't Know|Knew It →
A cylinder of height  and radius
  is expanding. The radius increases at a rate of
  and its height increases at a rate of
  . What is the rate of growth of its surface area?
A cylinder of height
Tap to reveal answer
The surface area of a cylinder is given by the formula:

To find the rate of growth over time, take the derivative of each side with respect to time:

Therefore, the rate of growth of surface area is:
\left(0.1\frac{in}{s}\right)+2\pi(1in)(4in)\left(0.1\frac{in}{s}\right)+2\pi(1in)\left(0.2\frac{in}{s}\right)")
\frac{in^2}{s}=1.6\pi\frac{in^2}{s}")
The surface area of a cylinder is given by the formula:
To find the rate of growth over time, take the derivative of each side with respect to time:
Therefore, the rate of growth of surface area is:
← Didn't Know|Knew It →
The rate of growth of the population of Reindeer in Norway is proportional to the population. The population increased from 9876 to 10381 between 2013 and 2015. What is the expected population in 2030?
The rate of growth of the population of Reindeer in Norway is proportional to the population. The population increased from 9876 to 10381 between 2013 and 2015. What is the expected population in 2030?
Tap to reveal answer
We're told that the rate of growth of the population is proportional to the population itself, meaning that this problem deals with exponential growth/decay. The population can be modeled thusly:
=p_0e^{kt}")
Where  is an initial population value, and
  is the constant of proportionality.
Since the population increased from 9876 to 10381 between 2013 and 2015, we can solve for this constant of proportionality:
}")

")
}{2}=0.0252")
Using this, we can calculate the expected value from 2015 to 2030:
(0.0252)} \approx 15150")
We're told that the rate of growth of the population is proportional to the population itself, meaning that this problem deals with exponential growth/decay. The population can be modeled thusly:
Where
Since the population increased from 9876 to 10381 between 2013 and 2015, we can solve for this constant of proportionality:
Using this, we can calculate the expected value from 2015 to 2030:
← Didn't Know|Knew It →
The rate of decrease due to poaching of the elephants in unprotected Sahara is proportional to the population. The population in one region decreased from 1038 to 817 between 2010 and 2015. What is the expected population in 2017?
The rate of decrease due to poaching of the elephants in unprotected Sahara is proportional to the population. The population in one region decreased from 1038 to 817 between 2010 and 2015. What is the expected population in 2017?
Tap to reveal answer
We're told that the rate of growth of the population is proportional to the population itself, meaning that this problem deals with exponential growth/decay. The population can be modeled thusly:
Where is an initial population value, and is the constant of proportionality.
Since the population decreased from 1038 to 817 between 2010 and 2015, we can solve for this constant of proportionality:
}")

")
}{5}=-0.048")
Using this, we can calculate the expected value from 2015 to 2017:
(-0.048)} \approx 742")
We're told that the rate of growth of the population is proportional to the population itself, meaning that this problem deals with exponential growth/decay. The population can be modeled thusly:
Where
Since the population decreased from 1038 to 817 between 2010 and 2015, we can solve for this constant of proportionality:
Using this, we can calculate the expected value from 2015 to 2017:
← Didn't Know|Knew It →

Tap to reveal answer
}{(17x - 2)}\end{align*}")
← Didn't Know|Knew It →