Functions and Graphs - Algebra 2
Card 1 of 2484
The vertex of the graph of the function
= -4x^{2}+ 12x - 9")
appears
The vertex of the graph of the function
appears
Tap to reveal answer
The graph of the quadratic function  = ax^{2} + bx+ c") is a parabola with its vertex at the point with coordinates
is a parabola with its vertex at the point with coordinates
 \right )") .
.
Set  ; the
; the  -coordinate is
} = - \frac{12}{-8} = \frac{3}{2} = 1\frac{1}{2}")
Evaluate ") by substitution:
by substitution:
= -4 \left ( \frac{3}{2} \right )^{2}+ 12 \left ( \frac{3}{2} \right ) - 9")
 + 12 \left ( \frac{3}{2} \right ) - 9")


The vertex has 0 as its  -coordinate; it is therefore on an axis.
The graph of the quadratic function
Set
Evaluate
The vertex has 0 as its
← Didn't Know|Knew It →
How many  -intercepts does the graph of the following function have?
= -4x^{2}+ 12x - 9")
How many
Tap to reveal answer
The graph of a quadratic function  = ax^{2}+ bx + c") has an
has an  -intercept at any point
 ") at which
at which  = 0") , so, first, set the quadratic expression equal to 0:
, so, first, set the quadratic expression equal to 0:

The number of -intercepts of the graph is equal to the number of real zeroes of the above equation, which can be determined by evaluating the discriminant of the equation,  . Set
. Set  , and evaluate:
(-9) = 144- 144 = 0")
The discriminant is equal to zero, so the quadratic equation has one real zero, and the graph of ") has exactly one -intercept.
has exactly one -intercept.
The graph of a quadratic function
The number of
The discriminant is equal to zero, so the quadratic equation has one real zero, and the graph of
← Didn't Know|Knew It →
Try without a calculator.
The graph with the following equation is a parabola characterized by which of the following?

Try without a calculator.
The graph with the following equation is a parabola characterized by which of the following?
Tap to reveal answer
The parabola of an equation of the form  is vertical, and faces upward or downward depending entirely on the sign of
  , the coefficient of
  . This coefficient,
  , is negative; the parabola is concave downward.
The parabola of an equation of the form
← Didn't Know|Knew It →
Try without a calculator.
The graph of a function with the given equation forms a parabola that is characterized by which of the following?

Try without a calculator.
The graph of a function with the given equation forms a parabola that is characterized by which of the following?
Tap to reveal answer
The graph of an equation of the form

is a horizontal parabola. Whether it is concave to the left or to the right depends on the sign of  . Since
  , a negative number, the parabola is concave to the left.
The graph of an equation of the form
is a horizontal parabola. Whether it is concave to the left or to the right depends on the sign of
← Didn't Know|Knew It →
Define a function  = -3x^{2}+ 7x + 1") .
.
Give the  -coordinate of the
  -intercept of its graph.
Define a function
Give the
Tap to reveal answer
The  -intercept of the graph of a function
 ") is the point at which it crosses the
is the point at which it crosses the  -axis; its
  -coordinate is 0, so its
  -coordinate is
 ") .
.
 = -3x^{2}+ 7x + 1") ,
,
so, by setting  ,
,
 = -3 \cdot 0^{2}+ 7\cdot 0 + 1 = 0 + 0 + 1 = 1") ,
,
making ") the
the  -intercept.
The
so, by setting
making
← Didn't Know|Knew It →
What is the degree of the polynomial?

What is the degree of the polynomial?
Tap to reveal answer
To find the degree of the polynomial, add up the exponents of each term and select the highest sum.
12x2y3: 2 + 3 = 5
6xy4z: 1 + 4 + 1 = 6
2xz: 1 + 1 = 2
The degree is therefore 6.
To find the degree of the polynomial, add up the exponents of each term and select the highest sum.
12x2y3: 2 + 3 = 5
6xy4z: 1 + 4 + 1 = 6
2xz: 1 + 1 = 2
The degree is therefore 6.
← Didn't Know|Knew It →
Give the degree of the polynomial.

Give the degree of the polynomial.
Tap to reveal answer

The degree of an individual term of a polynomial is the exponent of its variable; the exponents of the terms of this polynomial are, in order, 5, 4, 2, and 7.
The degree of the polynomial is the highest degree of any of the terms; in this case, it is 7.
The degree of an individual term of a polynomial is the exponent of its variable; the exponents of the terms of this polynomial are, in order, 5, 4, 2, and 7.
The degree of the polynomial is the highest degree of any of the terms; in this case, it is 7.
← Didn't Know|Knew It →
Which of the following depicts a polynomial in standard form?
Which of the following depicts a polynomial in standard form?
Tap to reveal answer
A polynomial in standard form is written in descending order of the power. The highest power should be first, and the lowest power should be last.

The answer has the powers decreasing from four, to two, to one, to zero.
A polynomial in standard form is written in descending order of the power. The highest power should be first, and the lowest power should be last.
The answer has the powers decreasing from four, to two, to one, to zero.
← Didn't Know|Knew It →
A polynomial consists of one or more terms where each tem has a coefficient and one or more variables raised to a whole number exponent. A term with an exponent of 0 is a constant.
Identify the expression below that is not a polynomial:


A polynomial consists of one or more terms where each tem has a coefficient and one or more variables raised to a whole number exponent. A term with an exponent of 0 is a constant.
Identify the expression below that is not a polynomial:
Tap to reveal answer
Expression 5 has the term  , which violates the definition of a polynomial. The exponent must be a whole number.
Expression 5 has the term
← Didn't Know|Knew It →
For the function  , please state the end behavior, find any local maxima and local minima, and then state whether the graph symmetry is even, odd, or neither even nor odd.
For the function 
Tap to reveal answer
To get started on this problem, it helps to use a graphing calculator or other graphing tool to visualize the function. The graph of  is below:
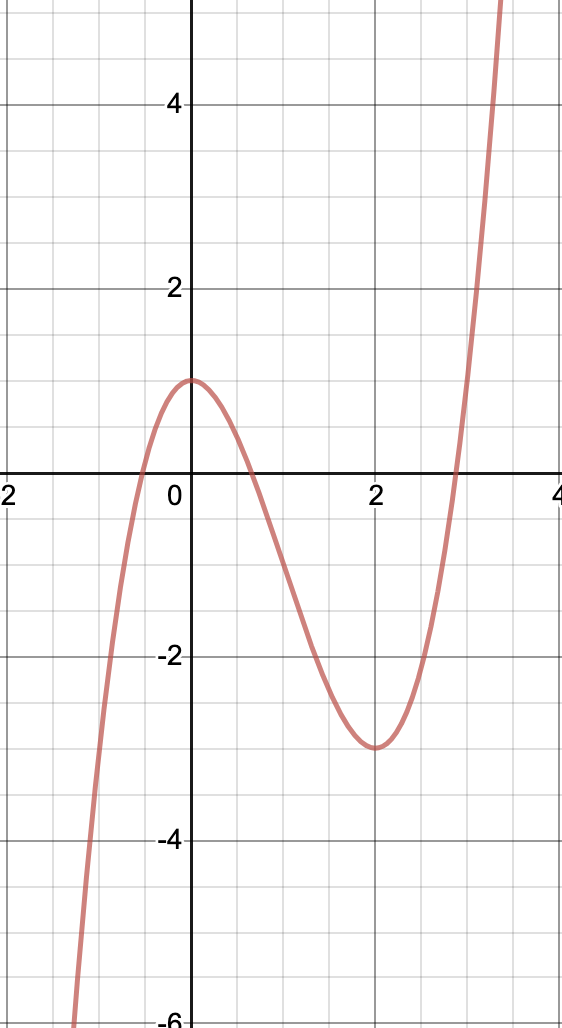
When identifying end behavior, you want to ask yourself "As x gets infinitely big/small, what happens to y?" If you start at x=0, then move left to where x=-1, you can see that the values of y are getting smaller and smaller (more and more negative.) Therefore, as x approaches negative infinity, y also approaches negative infinity. Next, look at x=2, then x=3, and so on, and you can see that as x gets bigger and bigger, so too does y. Therefore as x approaches infinity, y also approaches infinity. Mathematically, this is written like:
As  and as
  .
.
Next, the question asks to identify any local minima and maxima. It helps to think of these as "peaks" and "valleys." Looking at the graph, it appears that these exist at the points (0, 1) and (2, -3). We can check this algebraically by plugging in these x values and seeing that the associated y values come out of the function.
=x^3-3x^2+1")
=0^3-3\cdot 0^2+1 = 1")
=x^3-3x^2+1")
=2^3-3\cdot 2^2+1 = 8 - 12 +1 = -3")
This confirms that the point (0, 1) is a local maxima (peak) and the point (2, -3) is a local minima (valley).
Finally, the question asks us to determine whether the graph has even, odd, or no symmetry. In order for a graph to have even symmetry, it must produce the same image when reflected over the y-axis. The right side of this graph has a local minima, while the left side does not, therefore, this graph is not even. In order to have odd symmetry, the graph must have symmetry over the line y=x. An easy way to spot this is to see if the graph looks the same right side up as it does upside down. This does not, therefore, the graph has no symmetry. Algebraically, a function has even symmetry if f(x)=f(-x), and a function has odd symmetry if -f(x)=f(-x).
To get started on this problem, it helps to use a graphing calculator or other graphing tool to visualize the function. The graph of 
When identifying end behavior, you want to ask yourself "As x gets infinitely big/small, what happens to y?" If you start at x=0, then move left to where x=-1, you can see that the values of y are getting smaller and smaller (more and more negative.) Therefore, as x approaches negative infinity, y also approaches negative infinity. Next, look at x=2, then x=3, and so on, and you can see that as x gets bigger and bigger, so too does y. Therefore as x approaches infinity, y also approaches infinity. Mathematically, this is written like:
As 

Next, the question asks to identify any local minima and maxima. It helps to think of these as "peaks" and "valleys." Looking at the graph, it appears that these exist at the points (0, 1) and (2, -3). We can check this algebraically by plugging in these x values and seeing that the associated y values come out of the function.
=x^3-3x^2+1")
=0^3-3\cdot 0^2+1 = 1")
=x^3-3x^2+1")
=2^3-3\cdot 2^2+1 = 8 - 12 +1 = -3")
This confirms that the point (0, 1) is a local maxima (peak) and the point (2, -3) is a local minima (valley).
Finally, the question asks us to determine whether the graph has even, odd, or no symmetry. In order for a graph to have even symmetry, it must produce the same image when reflected over the y-axis. The right side of this graph has a local minima, while the left side does not, therefore, this graph is not even. In order to have odd symmetry, the graph must have symmetry over the line y=x. An easy way to spot this is to see if the graph looks the same right side up as it does upside down. This does not, therefore, the graph has no symmetry. Algebraically, a function has even symmetry if f(x)=f(-x), and a function has odd symmetry if -f(x)=f(-x).
← Didn't Know|Knew It →
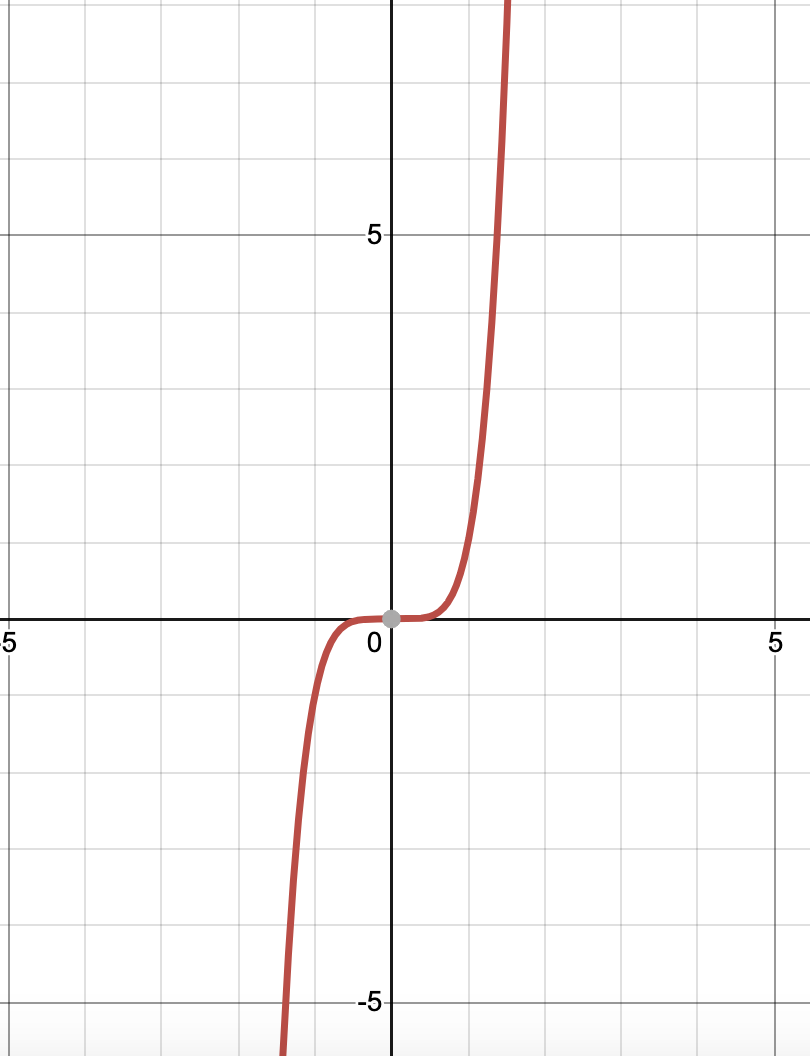
Below is the graph of =x^5")
Select the choice that correctly indicates this graph's end behavior.
Below is the graph of
=x^5")
Select the choice that correctly indicates this graph's end behavior.
Tap to reveal answer
When identifying end behavior, you want to ask yourself "As x gets infinitely big/small, what happens to y?" If you start at x=0, then move left to where x=-1, you can see that the values of y are getting smaller and smaller (more and more negative.) Therefore, as x approaches negative infinity, y also approaches negative infinity. Then start again at the origin, this time moving right. You can see that as x gets bigger and bigger, so too does y. Therefore as x approaches infinity, y also approaches infinity. Mathematically, this is written like:
As and as .
When identifying end behavior, you want to ask yourself "As x gets infinitely big/small, what happens to y?" If you start at x=0, then move left to where x=-1, you can see that the values of y are getting smaller and smaller (more and more negative.) Therefore, as x approaches negative infinity, y also approaches negative infinity. Then start again at the origin, this time moving right. You can see that as x gets bigger and bigger, so too does y. Therefore as x approaches infinity, y also approaches infinity. Mathematically, this is written like:
As
← Didn't Know|Knew It →
Below is the graph of =x^5")
Select the choice that correctly indicates whether this graph has even symmetry, odd symmetry, or neither.
Below is the graph of
=x^5")
Select the choice that correctly indicates whether this graph has even symmetry, odd symmetry, or neither.
Tap to reveal answer
The question asks us to determine whether the graph has even, odd, or no symmetry. In order for a graph to have even symmetry, it must produce the same image when reflected over the y-axis. Quadrant I (x and y both positive) has a piece of the graph, while Quadrant II (x negative, y positive) has no part of the graph. Because these are not matching, this graph is not even. In order to have odd symmetry, the graph must have symmetry over the line y=x. An easy way to spot this is to see if the graph looks the same right side up as it does upside down. This does have this quality, so it has odd symmetry. Algebraically, a function has even symmetry if f(x)=f(-x), and a function has odd symmetry if -f(x)=f(-x). You can plug in several test values of x to see this for yourself.
The question asks us to determine whether the graph has even, odd, or no symmetry. In order for a graph to have even symmetry, it must produce the same image when reflected over the y-axis. Quadrant I (x and y both positive) has a piece of the graph, while Quadrant II (x negative, y positive) has no part of the graph. Because these are not matching, this graph is not even. In order to have odd symmetry, the graph must have symmetry over the line y=x. An easy way to spot this is to see if the graph looks the same right side up as it does upside down. This does have this quality, so it has odd symmetry. Algebraically, a function has even symmetry if f(x)=f(-x), and a function has odd symmetry if -f(x)=f(-x). You can plug in several test values of x to see this for yourself.
← Didn't Know|Knew It →
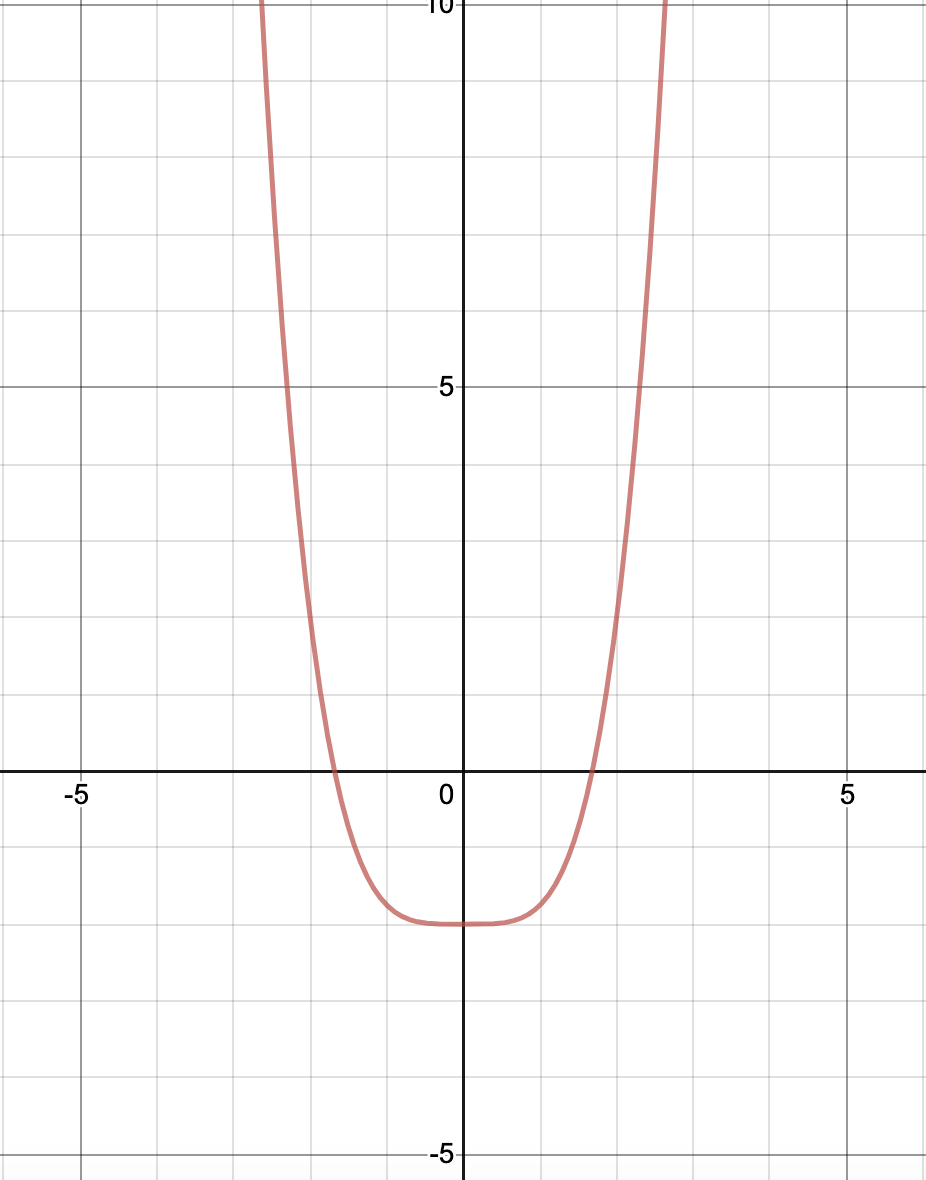
Below is the graph of =\frac{1}{4}x^4-2")
Select the choice that correctly indicates whether this graph has even symmetry, odd symmetry, or neither.
Below is the graph of
=\frac{1}{4}x^4-2")
Select the choice that correctly indicates whether this graph has even symmetry, odd symmetry, or neither.
Tap to reveal answer
The question asks us to determine whether the graph has even, odd, or no symmetry. In order for a graph to have even symmetry, it must produce the same image when reflected over the y-axis. We can see that what is on the left side of the line x=0 is an exact match of what is on the right side of the line x=0. Therefore, this graph has even symmetry. Algebraically, a function has even symmetry if f(x)=f(-x). You can plug in several test values of x to see this for yourself.
The question asks us to determine whether the graph has even, odd, or no symmetry. In order for a graph to have even symmetry, it must produce the same image when reflected over the y-axis. We can see that what is on the left side of the line x=0 is an exact match of what is on the right side of the line x=0. Therefore, this graph has even symmetry. Algebraically, a function has even symmetry if f(x)=f(-x). You can plug in several test values of x to see this for yourself.
← Didn't Know|Knew It →
Below is the graph of =\frac{1}{4}x^4-2")
Select the choice that correctly indicates this graph's end behavior.
Below is the graph of
=\frac{1}{4}x^4-2")
Select the choice that correctly indicates this graph's end behavior.
Tap to reveal answer
When identifying end behavior, you want to ask yourself "As x gets infinitely big/small, what happens to y?" If you start at x=0, then move left to where x=-1, you can see that the values of y are getting bigger and bigger (more and more positive.) Therefore, as x approaches negative infinity, y approaches infinity. Then start again at the origin, this time moving right. You can see that as x gets bigger and bigger, so too does y. Therefore as x approaches infinity, y also approaches infinity. Mathematically, this is written like:
As  and as .
When identifying end behavior, you want to ask yourself "As x gets infinitely big/small, what happens to y?" If you start at x=0, then move left to where x=-1, you can see that the values of y are getting bigger and bigger (more and more positive.) Therefore, as x approaches negative infinity, y approaches infinity. Then start again at the origin, this time moving right. You can see that as x gets bigger and bigger, so too does y. Therefore as x approaches infinity, y also approaches infinity. Mathematically, this is written like:
As 
← Didn't Know|Knew It →
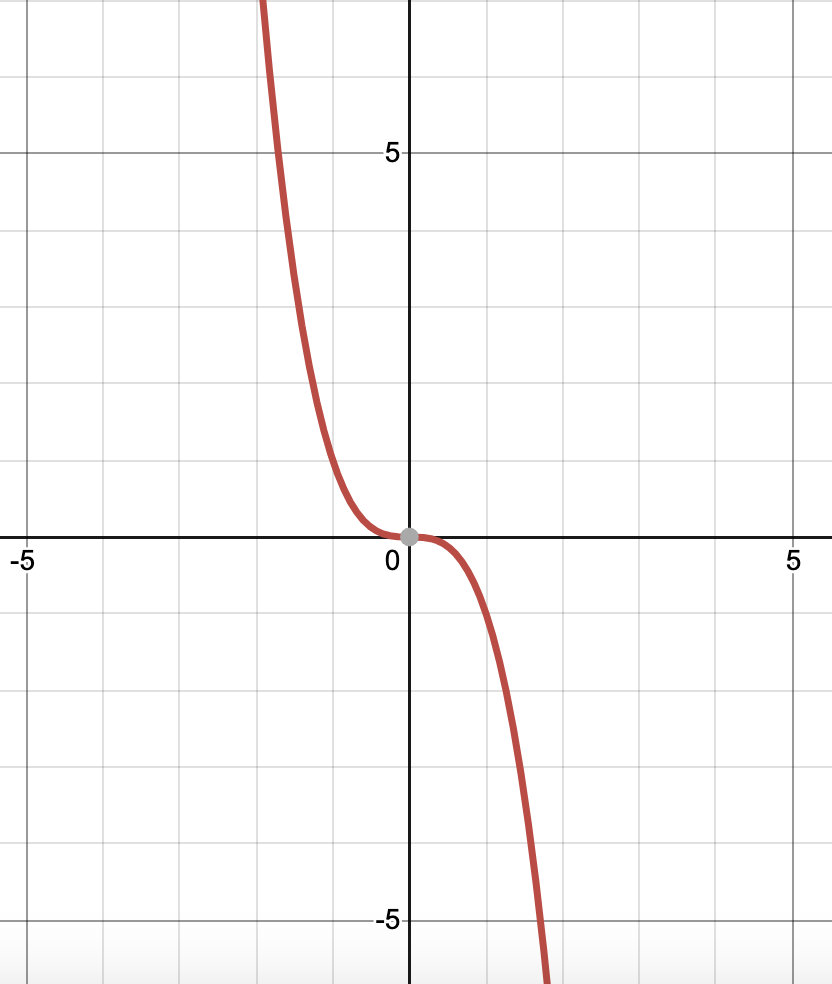
Below is the graph of =-x^3")
Select the choice that correctly indicates this graph's end behavior.
Below is the graph of
=-x^3")
Select the choice that correctly indicates this graph's end behavior.
Tap to reveal answer
When identifying end behavior, you want to ask yourself "As x gets infinitely big/small, what happens to y?" If you start at x=0, then move left to where x=-1, you can see that the values of y are getting bigger and bigger (more and more positive.) Therefore, as x approaches negative infinity, y approaches infinity. Then start again at the origin, this time moving right. You can see that as x gets bigger and bigger, y gets more and more negative. Therefore as x approaches infinity, y approaches negative infinity. Mathematically, this is written like:
As and as  .
.
When identifying end behavior, you want to ask yourself "As x gets infinitely big/small, what happens to y?" If you start at x=0, then move left to where x=-1, you can see that the values of y are getting bigger and bigger (more and more positive.) Therefore, as x approaches negative infinity, y approaches infinity. Then start again at the origin, this time moving right. You can see that as x gets bigger and bigger, y gets more and more negative. Therefore as x approaches infinity, y approaches negative infinity. Mathematically, this is written like:
As 
← Didn't Know|Knew It →
Below is the graph of =-x^3")
Select the choice that correctly indicates whether this graph has even symmetry, odd symmetry, or neither.
Below is the graph of
=-x^3")
Select the choice that correctly indicates whether this graph has even symmetry, odd symmetry, or neither.
Tap to reveal answer
The question asks us to determine whether the graph has even, odd, or no symmetry. In order for a graph to have even symmetry, it must produce the same image when reflected over the y-axis. Quadrant I (x and y both positive) has no piece of this graph, while Quadrant II (x negative, y positive) has a part of the graph. Because these are not matching, this graph is not even. In order to have odd symmetry, the graph must have symmetry over the line y=x. An easy way to spot this is to see if the graph looks the same right side up as it does upside down. This does have this quality, so it has odd symmetry. Algebraically, a function has even symmetry if f(x)=f(-x), and a function has odd symmetry if -f(x)=f(-x). You can plug in several test values of x to see this for yourself.
The question asks us to determine whether the graph has even, odd, or no symmetry. In order for a graph to have even symmetry, it must produce the same image when reflected over the y-axis. Quadrant I (x and y both positive) has no piece of this graph, while Quadrant II (x negative, y positive) has a part of the graph. Because these are not matching, this graph is not even. In order to have odd symmetry, the graph must have symmetry over the line y=x. An easy way to spot this is to see if the graph looks the same right side up as it does upside down. This does have this quality, so it has odd symmetry. Algebraically, a function has even symmetry if f(x)=f(-x), and a function has odd symmetry if -f(x)=f(-x). You can plug in several test values of x to see this for yourself.
← Didn't Know|Knew It →
Below is the graph of =x^5+5")
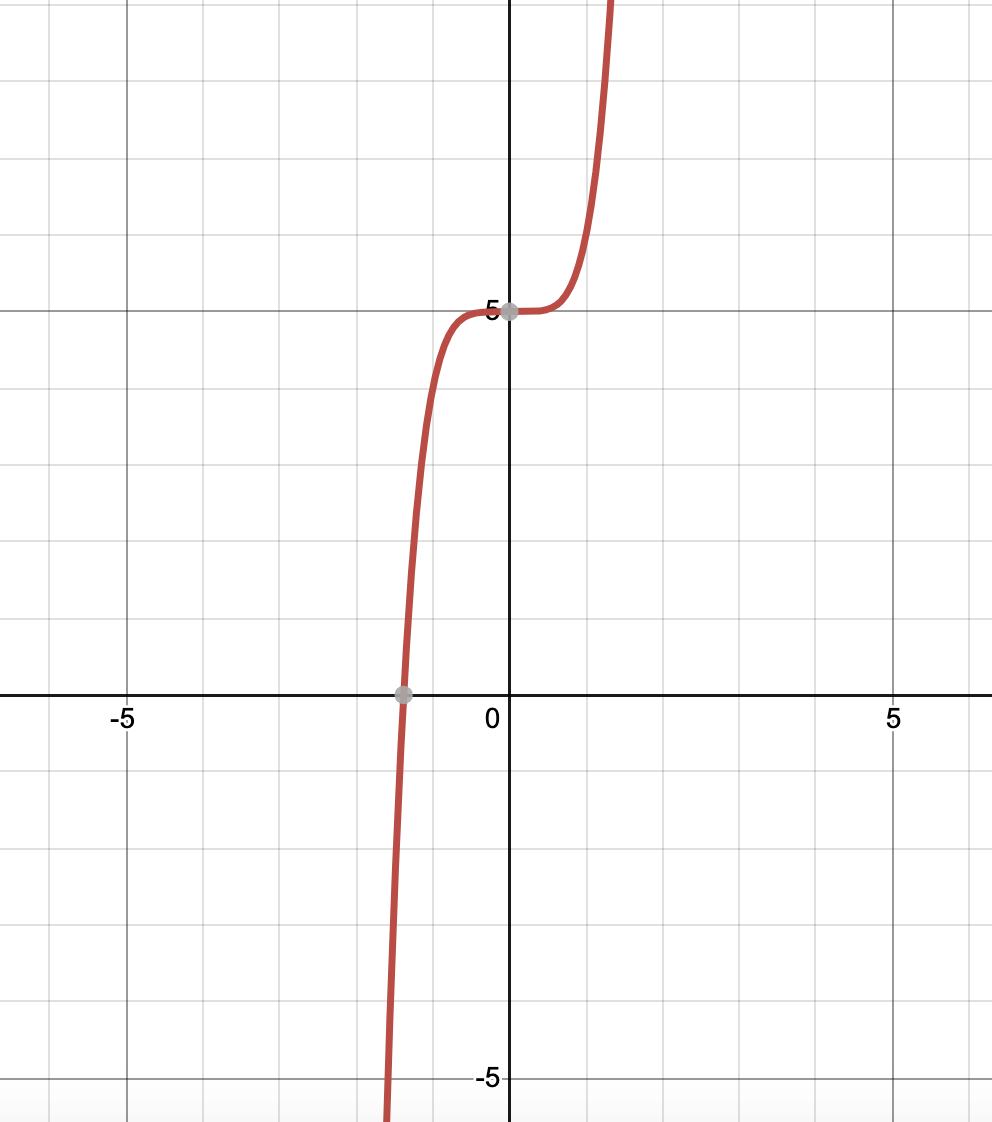
Select the choice that correctly indicates whether this graph has even symmetry, odd symmetry, or neither.
Below is the graph of
=x^5+5")
Select the choice that correctly indicates whether this graph has even symmetry, odd symmetry, or neither.
Tap to reveal answer
The question asks us to determine whether the graph has even, odd, or no symmetry. In order for a graph to have even symmetry, it must produce the same image when reflected over the y-axis. Quadrant I (x and y both positive) has a piece of the graph as does Quadrant II (x negative, y positive); however, these pieces are not mirror images of one another. Therefore, this graph is not even. In order to have odd symmetry, the graph must have symmetry over the line y=x. An easy way to spot this is to see if the graph looks the same right side up as it does upside down. In the original graph, the graph flattens above the origin, but if we flip this upside down, it flattens below the origin. While it has odd symmetry around the point (0, 5), it does not have symmetry around the origin, and therefore the function is not odd. Therefore, this graph does not have symmetry. Algebraically, a function has even symmetry if f(x)=f(-x), and a function has odd symmetry if -f(x)=f(-x). You can plug in several test values of x to see that neither of these are satisfied.
The question asks us to determine whether the graph has even, odd, or no symmetry. In order for a graph to have even symmetry, it must produce the same image when reflected over the y-axis. Quadrant I (x and y both positive) has a piece of the graph as does Quadrant II (x negative, y positive); however, these pieces are not mirror images of one another. Therefore, this graph is not even. In order to have odd symmetry, the graph must have symmetry over the line y=x. An easy way to spot this is to see if the graph looks the same right side up as it does upside down. In the original graph, the graph flattens above the origin, but if we flip this upside down, it flattens below the origin. While it has odd symmetry around the point (0, 5), it does not have symmetry around the origin, and therefore the function is not odd. Therefore, this graph does not have symmetry. Algebraically, a function has even symmetry if f(x)=f(-x), and a function has odd symmetry if -f(x)=f(-x). You can plug in several test values of x to see that neither of these are satisfied.
← Didn't Know|Knew It →
Below is the graph of =x^5+5")
Select the choice that correctly indicates this graph's end behavior.
Below is the graph of
=x^5+5")
Select the choice that correctly indicates this graph's end behavior.
Tap to reveal answer
When identifying end behavior, you want to ask yourself "As x gets infinitely big/small, what happens to y?" If you start at x=0, then move left to where x=-1, you can see that the values of y are getting smaller and smaller (more and more negative.) Therefore, as x approaches negative infinity, y also approaches negative infinity. Then start again at the origin, this time moving right. You can see that as x gets bigger and bigger, so too does y. Therefore as x approaches infinity, y also approaches infinity. Mathematically, this is written like:
As and as .
When identifying end behavior, you want to ask yourself "As x gets infinitely big/small, what happens to y?" If you start at x=0, then move left to where x=-1, you can see that the values of y are getting smaller and smaller (more and more negative.) Therefore, as x approaches negative infinity, y also approaches negative infinity. Then start again at the origin, this time moving right. You can see that as x gets bigger and bigger, so too does y. Therefore as x approaches infinity, y also approaches infinity. Mathematically, this is written like:
As
← Didn't Know|Knew It →
Find the domain:

Find the domain:
Tap to reveal answer
To find the domain, find all areas of the number line where the fraction is defined.
 because the denominator of a fraction must be nonzero.
Factor by finding two numbers that sum to -2 and multiply to 1. These numbers are -1 and -1.
(x-1)\neq0")

To find the domain, find all areas of the number line where the fraction is defined.
Factor by finding two numbers that sum to -2 and multiply to 1. These numbers are -1 and -1.
← Didn't Know|Knew It →
What is the domain of the function =\frac{2x}{x-2}") ?
?
What is the domain of the function
Tap to reveal answer
The domain is the set of x-values that make the function defined.
This function is defined everywhere except at  , since division by zero is undefined.
The domain is the set of x-values that make the function defined.
This function is defined everywhere except at
← Didn't Know|Knew It →