How to find data representation in biology - ACT Science
Card 0 of 2176
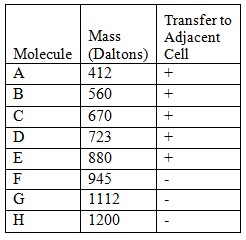
The cells of multicellular organisms must be linked to each other through special structures called cellular junctions. A gap junction is a type of cellular junction, which allows for the passage of small molecules for fast coordination between cells. For example, cardiac cells in the heart and neurons in the brain rely on gap junctions. However, gap junctions are small and there is a limit to how large a molecule can be in order for it to pass through the gap junction.
An experiment is designed to see how large molecules can be to pass through a gap junction. A single layer of cells is grown in a petri dish. A single cell is then injected with a dye labeled with a fluorescent molecule. Researchers observe the following:
Based on the experiment’s data, which of the following is the best conclusion?
The best answer is "Molecules 945 Daltons or greater in size do not pass through gap junctions." This is because we do not know about molecules between 880 and 945 Daltons. Also while parts of the other statements may be true but they are not the best description of the data's findings.
The best answer is "Molecules 945 Daltons or greater in size do not pass through gap junctions." This is because we do not know about molecules between 880 and 945 Daltons. Also while parts of the other statements may be true but they are not the best description of the data's findings.
Compare your answer with the correct one above
| | G | g | |
| ---- | -- | -- |
| g | Gg | gg |
| g | Gg | gg |
Scientist’s believe they have found the gene accountable for intelligence. The allele “G” is dominant, and the allele “g” is recessive. The intelligence gene is optimally expressed in the homozygous recessive form. The chart above shows the trait in the heterozygous form and the homozygous form. The form “gg” is from the mother, and “Gg” is from the father. The parents want to know what the gene might look like in their child.
What genotypes would two parents want to have to increase their chances of a child exhibiting an optimal intelligence phenotype?
| | G | g | | | ---- | -- | -- | | g | Gg | gg | | g | Gg | gg |
Scientist’s believe they have found the gene accountable for intelligence. The allele “G” is dominant, and the allele “g” is recessive. The intelligence gene is optimally expressed in the homozygous recessive form. The chart above shows the trait in the heterozygous form and the homozygous form. The form “gg” is from the mother, and “Gg” is from the father. The parents want to know what the gene might look like in their child.
What genotypes would two parents want to have to increase their chances of a child exhibiting an optimal intelligence phenotype?
Two parents with genotype "gg" would create a 100 percent chance of having a child with the "gg" genotype, which results in the optimal intelligence phenotype.
Two parents with genotype "gg" would create a 100 percent chance of having a child with the "gg" genotype, which results in the optimal intelligence phenotype.
Compare your answer with the correct one above
A group of scientists wanted to test the effects of Nitra-Grow, a chemical additive that can be given to plants to help them grow. 3 test groups of plants were given all the same time of sunlight, the same type of soil, and the same amount of water. Plant A was given no extra chemicals. Plant B was given 5g of Nitra-Grow. Plant C was given 5g of Ammonia to see if Nitra-Grow worked any better than a basic nitrogen-based household product. The plants are then measured on 5 consecutive days to find their average height (in cm).
DAY Height Plant A (cm) Height Plant B (cm) Height Plant C (cm) 1 1.2 1.2 1.2 2 1.4 1.4 1.2 3 1.6 1.8 1.3 4 1.8 2.4 1.3 5 2.0 2.6 1.4
On Day 7, what would be plant A’s approximate height?
A group of scientists wanted to test the effects of Nitra-Grow, a chemical additive that can be given to plants to help them grow. 3 test groups of plants were given all the same time of sunlight, the same type of soil, and the same amount of water. Plant A was given no extra chemicals. Plant B was given 5g of Nitra-Grow. Plant C was given 5g of Ammonia to see if Nitra-Grow worked any better than a basic nitrogen-based household product. The plants are then measured on 5 consecutive days to find their average height (in cm).
| DAY | Height Plant A (cm) | Height Plant B (cm) | Height Plant C (cm) |
|---|---|---|---|
| 1 | 1.2 | 1.2 | 1.2 |
| 2 | 1.4 | 1.4 | 1.2 |
| 3 | 1.6 | 1.8 | 1.3 |
| 4 | 1.8 | 2.4 | 1.3 |
| 5 | 2.0 | 2.6 | 1.4 |
On Day 7, what would be plant A’s approximate height?
The answer is 2.4cm. Every day, plant A increases by a normal rate of 0.2cm per day. Thus adding 0.2 two times to 2.0 will result in 2.4cm.
The answer is 2.4cm. Every day, plant A increases by a normal rate of 0.2cm per day. Thus adding 0.2 two times to 2.0 will result in 2.4cm.
Compare your answer with the correct one above

The chart above shows the height growth of three different plant species after a period of 2 weeks. Each plant species was grown in 4 different soil mediums. All the plants were grown in the same environment with equal amounts of light, water, and oxygen.
What could be added to this experiment to improve the data representation?
All of the options listed would make the data representation better.
All of the options listed would make the data representation better.
Compare your answer with the correct one above
A group of scientists wanted to test the effects of Nitra-Grow, a chemical additive that can be given to plants to help them grow. 3 test groups of plants were given all the same time of sunlight, the same type of soil, and the same amount of water. Plant A was given no extra chemicals. Plant B was given 5g of Nitra-Grow. Plant C was given 5g of Ammonia to see if Nitra-Grow worked any better than a basic nitrogen-based household product. The plants are then measured on 5 consecutive days to find their average height (in cm).
DAY Height Plant A (cm) Height Plant B (cm) Height Plant C (cm) 1 1.2 1.2 1.2 2 1.4 1.4 1.2 3 1.6 1.8 1.3 4 1.8 2.4 1.3 5 2.0 2.6 1.4
Which plant is the control group?
A group of scientists wanted to test the effects of Nitra-Grow, a chemical additive that can be given to plants to help them grow. 3 test groups of plants were given all the same time of sunlight, the same type of soil, and the same amount of water. Plant A was given no extra chemicals. Plant B was given 5g of Nitra-Grow. Plant C was given 5g of Ammonia to see if Nitra-Grow worked any better than a basic nitrogen-based household product. The plants are then measured on 5 consecutive days to find their average height (in cm).
| DAY | Height Plant A (cm) | Height Plant B (cm) | Height Plant C (cm) |
|---|---|---|---|
| 1 | 1.2 | 1.2 | 1.2 |
| 2 | 1.4 | 1.4 | 1.2 |
| 3 | 1.6 | 1.8 | 1.3 |
| 4 | 1.8 | 2.4 | 1.3 |
| 5 | 2.0 | 2.6 | 1.4 |
Which plant is the control group?
The answer is Plant A. Plant A is getting no extra treatment, whereas Plants B and C are getting added chemicals. (Even though Plant C is being compared as a generic chemical vs. name brand chemical, it is still getting treatment)
The answer is Plant A. Plant A is getting no extra treatment, whereas Plants B and C are getting added chemicals. (Even though Plant C is being compared as a generic chemical vs. name brand chemical, it is still getting treatment)
Compare your answer with the correct one above
Chemotherapy No treatment Surgery and Chemotherapy 2 inches 2 inches 2 inches 2.1 inches 3 inches .05 inches 1.8 inches 5 inches .09 inches 1.4 inches 7 inches .05 inches 1 inch 9 inches .03 inches
The table above shows measurements for tumor size growth over time within three different possible treatment methods. Each tumor was first documented at an initial size of 2 inches. Every month each tumor was measured, for a total of five measurements of each tumor.
Looking at the "Surgery and Chemotherapy" treatment column, where could one infer that chemotherapy was performed?
| Chemotherapy | No treatment | Surgery and Chemotherapy |
|---|---|---|
| 2 inches | 2 inches | 2 inches |
| 2.1 inches | 3 inches | .05 inches |
| 1.8 inches | 5 inches | .09 inches |
| 1.4 inches | 7 inches | .05 inches |
| 1 inch | 9 inches | .03 inches |
The table above shows measurements for tumor size growth over time within three different possible treatment methods. Each tumor was first documented at an initial size of 2 inches. Every month each tumor was measured, for a total of five measurements of each tumor.
Looking at the "Surgery and Chemotherapy" treatment column, where could one infer that chemotherapy was performed?
One would think that surgery as opposed to chemotherapy resulted in a drastic reduction of tumor size; therefore, the smaller reduction of size can be attributed to chemotherapy (0.09 to 0.05).
One would think that surgery as opposed to chemotherapy resulted in a drastic reduction of tumor size; therefore, the smaller reduction of size can be attributed to chemotherapy (0.09 to 0.05).
Compare your answer with the correct one above
Chemotherapy No treatment Surgery and Chemotherapy 2 inches 2 inches 2 inches 2.1 inches 3 inches .05 inches 1.8 inches 5 inches .09 inches 1.4 inches 7 inches .05 inches 1 inch 9 inches .03 inches
The table above shows measurements for tumor size growth over time within three different possible treatment methods. Each tumor was first documented at an initial size of 2 inches. Every month each tumor was measured, for a total of five measurements of each tumor.
Based on the table above, which single method is most effective at reducing tumor size in the shortest period of time?
| Chemotherapy | No treatment | Surgery and Chemotherapy |
|---|---|---|
| 2 inches | 2 inches | 2 inches |
| 2.1 inches | 3 inches | .05 inches |
| 1.8 inches | 5 inches | .09 inches |
| 1.4 inches | 7 inches | .05 inches |
| 1 inch | 9 inches | .03 inches |
The table above shows measurements for tumor size growth over time within three different possible treatment methods. Each tumor was first documented at an initial size of 2 inches. Every month each tumor was measured, for a total of five measurements of each tumor.
Based on the table above, which single method is most effective at reducing tumor size in the shortest period of time?
The tumor size decrease from surgery alone was 2 to 0.05 inches, the largest decrease on the chart. Don't be tricked into answering "Surgery and Chemotherapy" because the questions asks for which single method is most effective.
The tumor size decrease from surgery alone was 2 to 0.05 inches, the largest decrease on the chart. Don't be tricked into answering "Surgery and Chemotherapy" because the questions asks for which single method is most effective.
Compare your answer with the correct one above
Chemotherapy No treatment Surgery and Chemotherapy 2 inches 2 inches 2 inches 2.1 inches 3 inches .05 inches 1.8 inches 5 inches .09 inches 1.4 inches 7 inches .05 inches 1 inch 9 inches .03 inches
The table above shows measurements for tumor size growth over time within three different possible treatment methods. Each tumor was first documented at an initial size of 2 inches. Every month each tumor was measured, for a total of five measurements of each tumor.
What information would be most important to know before drawing conclusions based on this data?
| Chemotherapy | No treatment | Surgery and Chemotherapy |
|---|---|---|
| 2 inches | 2 inches | 2 inches |
| 2.1 inches | 3 inches | .05 inches |
| 1.8 inches | 5 inches | .09 inches |
| 1.4 inches | 7 inches | .05 inches |
| 1 inch | 9 inches | .03 inches |
The table above shows measurements for tumor size growth over time within three different possible treatment methods. Each tumor was first documented at an initial size of 2 inches. Every month each tumor was measured, for a total of five measurements of each tumor.
What information would be most important to know before drawing conclusions based on this data?
The key is here the phrase most important. The location and stage of the cancer would play the biggest role in terms of treatment results. All of the other information would be helpful, but the question asks to prioritize which is the most important.
The key is here the phrase most important. The location and stage of the cancer would play the biggest role in terms of treatment results. All of the other information would be helpful, but the question asks to prioritize which is the most important.
Compare your answer with the correct one above
Error bars are utilized in scientific graphs to show the difference between data points. If the error bars of data points overlap then they are not statistically independent from one another; therefore, they can be considered to be similar to one another. Only data points that possess non-overlapping error bars are sufficient to make or support a scientific conclusion.

Are these data points statistically independent from one another?
Error bars are utilized in scientific graphs to show the difference between data points. If the error bars of data points overlap then they are not statistically independent from one another; therefore, they can be considered to be similar to one another. Only data points that possess non-overlapping error bars are sufficient to make or support a scientific conclusion.
Are these data points statistically independent from one another?
Yes, the error bars do not overlap.
The error bars within the data points of the graph do not overlap. According to the passage, they are statistically independent from one another.
Yes, the error bars do not overlap.
The error bars within the data points of the graph do not overlap. According to the passage, they are statistically independent from one another.
Compare your answer with the correct one above
Chemotherapy No treatment Surgery and Chemotherapy 2 inches 2 inches 2 inches 2.1 inches 3 inches .05 inches 1.8 inches 5 inches .09 inches 1.4 inches 7 inches .05 inches 1 inch 9 inches .03 inches
The table above shows measurements for tumor size growth over time within three different possible treatment methods. Each tumor was first documented at an initial size of 2 inches. Every month each tumor was measured, for a total of five measurements of each tumor.
Based on the chart above, what conclusion could be drawn about the "no treatment" option?
| Chemotherapy | No treatment | Surgery and Chemotherapy |
|---|---|---|
| 2 inches | 2 inches | 2 inches |
| 2.1 inches | 3 inches | .05 inches |
| 1.8 inches | 5 inches | .09 inches |
| 1.4 inches | 7 inches | .05 inches |
| 1 inch | 9 inches | .03 inches |
The table above shows measurements for tumor size growth over time within three different possible treatment methods. Each tumor was first documented at an initial size of 2 inches. Every month each tumor was measured, for a total of five measurements of each tumor.
Based on the chart above, what conclusion could be drawn about the "no treatment" option?
Based on the data, the only conclusion that can be drawn is the tumor size increases. One might be tempted to draw the conclusion out further and say that some treatment is always better than no treatment; however, that is a circumstantial conclusion based on the individual patient cases, and cannot be concluded from the data shown.
Based on the data, the only conclusion that can be drawn is the tumor size increases. One might be tempted to draw the conclusion out further and say that some treatment is always better than no treatment; however, that is a circumstantial conclusion based on the individual patient cases, and cannot be concluded from the data shown.
Compare your answer with the correct one above
Chemotherapy No treatment Surgery and Chemotherapy 2 inches 2 inches 2 inches 2.1 inches 3 inches .05 inches 1.8 inches 5 inches .09 inches 1.4 inches 7 inches .05 inches 1 inch 9 inches .03 inches
The table above shows measurements for tumor size growth over time within three different possible treatment methods. Each tumor was first documented at an initial size of 2 inches. Every month each tumor was measured, for a total of five measurements of each tumor.
What conclusion CANNOT be reached based on the data shown above?
| Chemotherapy | No treatment | Surgery and Chemotherapy |
|---|---|---|
| 2 inches | 2 inches | 2 inches |
| 2.1 inches | 3 inches | .05 inches |
| 1.8 inches | 5 inches | .09 inches |
| 1.4 inches | 7 inches | .05 inches |
| 1 inch | 9 inches | .03 inches |
The table above shows measurements for tumor size growth over time within three different possible treatment methods. Each tumor was first documented at an initial size of 2 inches. Every month each tumor was measured, for a total of five measurements of each tumor.
What conclusion CANNOT be reached based on the data shown above?
There is not enough information in the data to know that the cancer cells in all three groups grew at the same rate. Cancer cells can grow at different rates depending on size, stage, and other factors.
There is not enough information in the data to know that the cancer cells in all three groups grew at the same rate. Cancer cells can grow at different rates depending on size, stage, and other factors.
Compare your answer with the correct one above
| | G | g | |
| ---- | -- | -- |
| g | Gg | gg |
| g | Gg | gg |
Scientist’s believe they have found the gene accountable for intelligence. The allele “G” is dominant, and the allele “g” is recessive. The intelligence gene is optimally expressed in the homozygous recessive form. The chart above shows the trait in the heterozygous form and the homozygous form. The form “gg” is from the mother, and “Gg” is from the father. The parents want to know what the gene might look like in their child.
What form of the gene expresses optimal intelligence?
| | G | g | | | ---- | -- | -- | | g | Gg | gg | | g | Gg | gg |
Scientist’s believe they have found the gene accountable for intelligence. The allele “G” is dominant, and the allele “g” is recessive. The intelligence gene is optimally expressed in the homozygous recessive form. The chart above shows the trait in the heterozygous form and the homozygous form. The form “gg” is from the mother, and “Gg” is from the father. The parents want to know what the gene might look like in their child.
What form of the gene expresses optimal intelligence?
The prompt states the intelligence gene is "optimally expressed in the homozygous recessive form." Therefore, this is the "gg" form.
The prompt states the intelligence gene is "optimally expressed in the homozygous recessive form." Therefore, this is the "gg" form.
Compare your answer with the correct one above
| | G | g | |
| ---- | -- | -- |
| g | Gg | gg |
| g | Gg | gg |
Scientist’s believe they have found the gene accountable for intelligence. The allele “G” is dominant, and the allele “g” is recessive. The intelligence gene is optimally expressed in the homozygous recessive form. The chart above shows the trait in the heterozygous form and the homozygous form. The form “gg” is from the mother, and “Gg” is from the father. The parents want to know what the gene might look like in their child.
According to the chart above, what are the chances of the child inheriting the optimal form of the gene?
| | G | g | | | ---- | -- | -- | | g | Gg | gg | | g | Gg | gg |
Scientist’s believe they have found the gene accountable for intelligence. The allele “G” is dominant, and the allele “g” is recessive. The intelligence gene is optimally expressed in the homozygous recessive form. The chart above shows the trait in the heterozygous form and the homozygous form. The form “gg” is from the mother, and “Gg” is from the father. The parents want to know what the gene might look like in their child.
According to the chart above, what are the chances of the child inheriting the optimal form of the gene?
The optimal form of the gene is the homozygous reccesive "gg," which has a 50 percent chance of resulting from the parental cross.
The optimal form of the gene is the homozygous reccesive "gg," which has a 50 percent chance of resulting from the parental cross.
Compare your answer with the correct one above
| | G | g | |
| ---- | -- | -- |
| g | Gg | gg |
| g | Gg | gg |
Scientist’s believe they have found the gene accountable for intelligence. The allele “G” is dominant, and the allele “g” is recessive. The intelligence gene is optimally expressed in the homozygous recessive form. The chart above shows the trait in the heterozygous form and the homozygous form. The form “gg” is from the mother, and “Gg” is from the father. The parents want to know what the gene might look like in their child.
According to the data given, what could one infer about the phenotype for "Gg?"
| | G | g | | | ---- | -- | -- | | g | Gg | gg | | g | Gg | gg |
Scientist’s believe they have found the gene accountable for intelligence. The allele “G” is dominant, and the allele “g” is recessive. The intelligence gene is optimally expressed in the homozygous recessive form. The chart above shows the trait in the heterozygous form and the homozygous form. The form “gg” is from the mother, and “Gg” is from the father. The parents want to know what the gene might look like in their child.
According to the data given, what could one infer about the phenotype for "Gg?"
The prompt does not tell what the phenotype of "Gg" is, it just mentions the phenotype for "gg" is optimal intelligence.
The prompt does not tell what the phenotype of "Gg" is, it just mentions the phenotype for "gg" is optimal intelligence.
Compare your answer with the correct one above
The significant increase in atmospheric carbon dioxide since pre-industrial levels can be seen in the world’s oceans which absorb the CO2 and in turn undergo changes in chemistry. The consequences of increased CO2 include acidification of seawater and a decrease in carbonate ion (CO32-) concentration.
Changes in seawater chemistry affect marine organisms. The early life stages of invertebrates, such as squid, may be particularly vulnerable to changes in carbon dioxide levels. Acting as both predator and prey, squid are a significant component of marine ecosystems. For example, fish and sea birds, such as tuna and albatross, are dependent on squid as a source of prey. Furthermore, the fishing industry is impacted by the health of squid populations. California fisheries produce the majority of market squid.
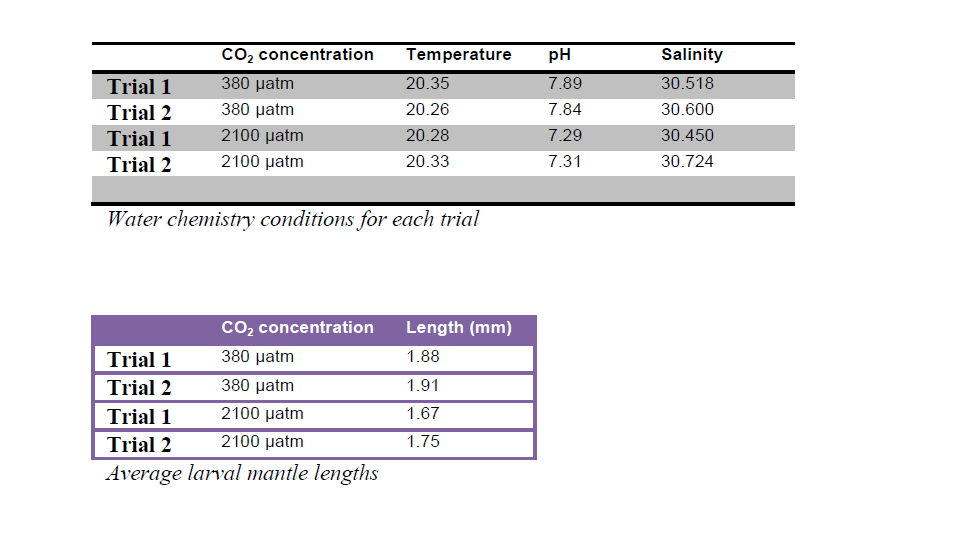
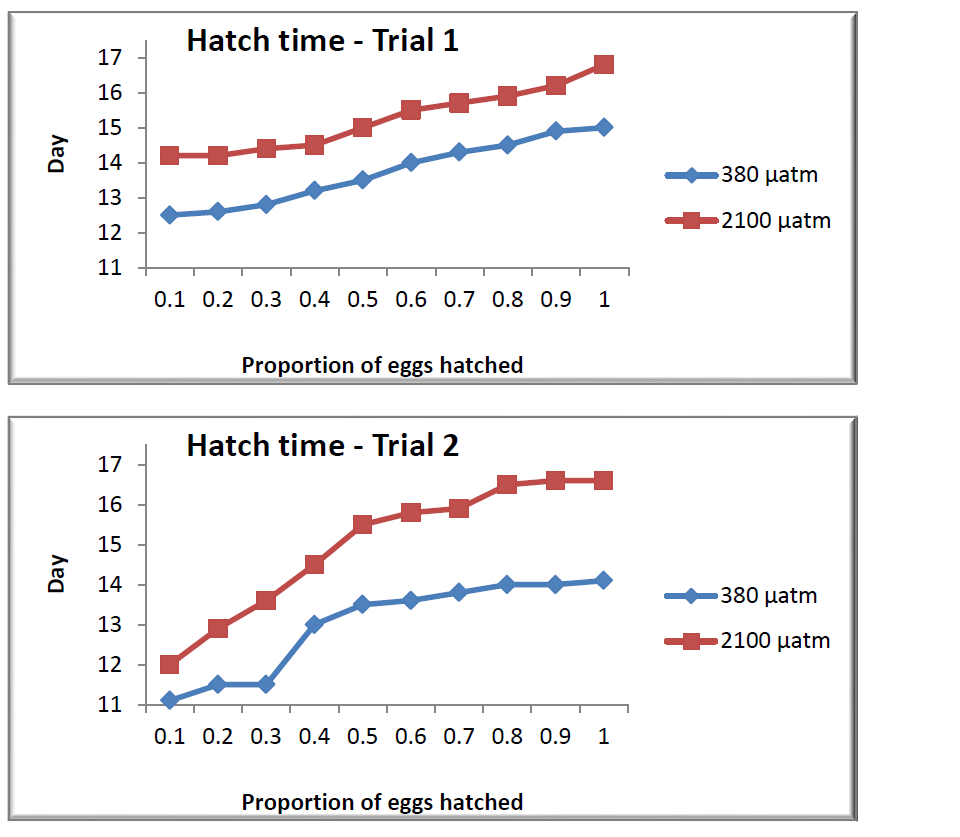
In order to determine how increased levels of carbon dioxide affect the development of squid, eggs were hatched in two different conditions: normal (380 µatm) and elevated (2100 µatm) levels of CO2. The time to hatch and the size of the larval mantle (the anatomical feature that includes the body wall and fins) were measured and recorded. Two trials were conducted for each carbon dioxide concentration.
Compared to the hatch time data in Trial 1, .
The significant increase in atmospheric carbon dioxide since pre-industrial levels can be seen in the world’s oceans which absorb the CO2 and in turn undergo changes in chemistry. The consequences of increased CO2 include acidification of seawater and a decrease in carbonate ion (CO32-) concentration.
Changes in seawater chemistry affect marine organisms. The early life stages of invertebrates, such as squid, may be particularly vulnerable to changes in carbon dioxide levels. Acting as both predator and prey, squid are a significant component of marine ecosystems. For example, fish and sea birds, such as tuna and albatross, are dependent on squid as a source of prey. Furthermore, the fishing industry is impacted by the health of squid populations. California fisheries produce the majority of market squid.
In order to determine how increased levels of carbon dioxide affect the development of squid, eggs were hatched in two different conditions: normal (380 µatm) and elevated (2100 µatm) levels of CO2. The time to hatch and the size of the larval mantle (the anatomical feature that includes the body wall and fins) were measured and recorded. Two trials were conducted for each carbon dioxide concentration.
Compared to the hatch time data in Trial 1, .
Comparing the difference between the curves of normal and elevated carbon dioxide egg hatching data, we see that the lines diverge more so in Trial 2:
Comparing the difference between the curves of normal and elevated carbon dioxide egg hatching data, we see that the lines diverge more so in Trial 2:
Compare your answer with the correct one above
The significant increase in atmospheric carbon dioxide since pre-industrial levels can be seen in the world’s oceans which absorb the CO2 and in turn undergo changes in chemistry. The consequences of increased CO2 include acidification of seawater and a decrease in carbonate ion (CO32-) concentration.
Changes in seawater chemistry affect marine organisms. The early life stages of invertebrates, such as squid, may be particularly vulnerable to changes in carbon dioxide levels. Acting as both predator and prey, squid are a significant component of marine ecosystems. For example, fish and sea birds, such as tuna and albatross, are dependent on squid as a source of prey. Furthermore, the fishing industry is impacted by the health of squid populations. California fisheries produce the majority of market squid.
In order to determine how increased levels of carbon dioxide affect the development of squid, eggs were hatched in two different conditions: normal (380 µatm) and elevated (2100 µatm) levels of CO2. The time to hatch and the size of the larval mantle (the anatomical feature that includes the body wall and fins) were measured and recorded. Two trials were conducted for each carbon dioxide concentration.
For water with a carbon dioxide concentration of 380 µatm, when would half of squid eggs be expected to be hatched?
The question asks us to determine when half of the squid eggs would be hatched in the 380 µatm group (blue line). For this question, you can ignore the red lines. On the  -axis, find 0.5 (this corresponds to half of the eggs). Then, find the corresponding number of days on the
  -axis. We find that 0.5 falls between days 13 and 14 for Trials 1 and 2.
The question asks us to determine when half of the squid eggs would be hatched in the 380 µatm group (blue line). For this question, you can ignore the red lines. On the
Compare your answer with the correct one above
The significant increase in atmospheric carbon dioxide since pre-industrial levels can be seen in the world’s oceans which absorb the CO2 and in turn undergo changes in chemistry. The consequences of increased CO2 include acidification of seawater and a decrease in carbonate ion (CO32-) concentration.
Changes in seawater chemistry affect marine organisms. The early life stages of invertebrates, such as squid, may be particularly vulnerable to changes in carbon dioxide levels. Acting as both predator and prey, squid are a significant component of marine ecosystems. For example, fish and sea birds, such as tuna and albatross, are dependent on squid as a source of prey. Furthermore, the fishing industry is impacted by the health of squid populations. California fisheries produce the majority of market squid.
In order to determine how increased levels of carbon dioxide affect the development of squid, eggs were hatched in two different conditions: normal (380 µatm) and elevated (2100 µatm) levels of CO2. The time to hatch and the size of the larval mantle (the anatomical feature that includes the body wall and fins) were measured and recorded. Two trials were conducted for each carbon dioxide concentration.
On average, approximately how many days apart do 100% of the eggs hatch in the normal and elevated  groups?
The significant increase in atmospheric carbon dioxide since pre-industrial levels can be seen in the world’s oceans which absorb the CO2 and in turn undergo changes in chemistry. The consequences of increased CO2 include acidification of seawater and a decrease in carbonate ion (CO32-) concentration.
Changes in seawater chemistry affect marine organisms. The early life stages of invertebrates, such as squid, may be particularly vulnerable to changes in carbon dioxide levels. Acting as both predator and prey, squid are a significant component of marine ecosystems. For example, fish and sea birds, such as tuna and albatross, are dependent on squid as a source of prey. Furthermore, the fishing industry is impacted by the health of squid populations. California fisheries produce the majority of market squid.
In order to determine how increased levels of carbon dioxide affect the development of squid, eggs were hatched in two different conditions: normal (380 µatm) and elevated (2100 µatm) levels of CO2. The time to hatch and the size of the larval mantle (the anatomical feature that includes the body wall and fins) were measured and recorded. Two trials were conducted for each carbon dioxide concentration.
On average, approximately how many days apart do 100% of the eggs hatch in the normal and elevated
We are asked to find the number of days between the hatching of all of the eggs in the normal (blue line) and elevated (red line) carbon dioxide groups. To do this, locate the endponts of the lines (at  ) in Trial 1. All of the eggs in the normal group hatch just after day 14; those in the elevated group hatch at about day 17 (a difference of about three days). Repeat this for Trial 2; again we find a difference of about three days.
We are asked to find the number of days between the hatching of all of the eggs in the normal (blue line) and elevated (red line) carbon dioxide groups. To do this, locate the endponts of the lines (at
Compare your answer with the correct one above
The significant increase in atmospheric carbon dioxide since pre-industrial levels can be seen in the world’s oceans which absorb the CO2 and in turn undergo changes in chemistry. The consequences of increased CO2 include acidification of seawater and a decrease in carbonate ion (CO32-) concentration.
Changes in seawater chemistry affect marine organisms. The early life stages of invertebrates, such as squid, may be particularly vulnerable to changes in carbon dioxide levels. Acting as both predator and prey, squid are a significant component of marine ecosystems. For example, fish and sea birds, such as tuna and albatross, are dependent on squid as a source of prey. Furthermore, the fishing industry is impacted by the health of squid populations. California fisheries produce the majority of market squid.
In order to determine how increased levels of carbon dioxide affect the development of squid, eggs were hatched in two different conditions: normal (380 µatm) and elevated (2100 µatm) levels of CO2. The time to hatch and the size of the larval mantle (the anatomical feature that includes the body wall and fins) were measured and recorded. Two trials were conducted for each carbon dioxide concentration.
For which group was the rate of egg hatching the slowest?
Here we are asked to find which of the lines below represents the slowest rate of egg hatching. Since 100% of the eggs eventually hatched for each group, the question becomes for which group did hatching span the most number of days. In the elevated group (red line) in Trial 2, egg hatching began at day 12 and lasted until about day 17. Since this represents the longest period of egg hatching activity among the groups, the rate of hatching is the slowest in the Trial 2, elevated group.
Here we are asked to find which of the lines below represents the slowest rate of egg hatching. Since 100% of the eggs eventually hatched for each group, the question becomes for which group did hatching span the most number of days. In the elevated group (red line) in Trial 2, egg hatching began at day 12 and lasted until about day 17. Since this represents the longest period of egg hatching activity among the groups, the rate of hatching is the slowest in the Trial 2, elevated group.
Compare your answer with the correct one above
A new drug is in its clinical trial phase. The graph below shows the data for participants sleep patterns before medication use and then after using the medication for three months. Series 1 shows the average hours slept a night for each participant prior to medication. Series 2 shows the average hours slept a night for each participant after three months of use. The average hours slept a night was obtained by recording sleep every night for one month, and then finding the average. Patients one through five took a placebo pil, not the actual Moonlight medication. Note: The y-axis is measured in hours slept a night, while the x-axis lists each anonymous patient numerically.

The overall trend when comparing sleep before and after mediciation use is .
A new drug is in its clinical trial phase. The graph below shows the data for participants sleep patterns before medication use and then after using the medication for three months. Series 1 shows the average hours slept a night for each participant prior to medication. Series 2 shows the average hours slept a night for each participant after three months of use. The average hours slept a night was obtained by recording sleep every night for one month, and then finding the average. Patients one through five took a placebo pil, not the actual Moonlight medication. Note: The y-axis is measured in hours slept a night, while the x-axis lists each anonymous patient numerically.
The overall trend when comparing sleep before and after mediciation use is .
Looking at the graph, one will see the patients who slept the least before medication usage (patients 4, 6, and 9), had the largest increase in hours slept. Further, patient 7 and patient 3 had the greatest amount of hours slept prior to medication usage. These two patients had the smallest increase in average sleeping hours.
Looking at the graph, one will see the patients who slept the least before medication usage (patients 4, 6, and 9), had the largest increase in hours slept. Further, patient 7 and patient 3 had the greatest amount of hours slept prior to medication usage. These two patients had the smallest increase in average sleeping hours.
Compare your answer with the correct one above
A new drug is in its clinical trial phase. The graph below shows the data for participants sleep patterns before medication use and then after using the medication for three months. Series 1 shows the average hours slept a night for each participant prior to medication. Series 2 shows the average hours slept a night for each participant after three months of use. The average hours slept a night was obtained by recording sleep every night for one month, and then finding the average. Patients one through five took a placebo pil, not the actual Moonlight medication. Note: The y-axis is measured in hours slept a night, while the x-axis lists each anonymous patient numerically.
What information would strengthen the experiment?
This experiment takes into account the total average hours slept each night. While the medication seems to improve the total hours slept, it leaves out how consecutive the hours. An individual who sleeps a total of seven hours a night but wakes up five times a night will not show an improvement based on the way the results are measured.
This experiment takes into account the total average hours slept each night. While the medication seems to improve the total hours slept, it leaves out how consecutive the hours. An individual who sleeps a total of seven hours a night but wakes up five times a night will not show an improvement based on the way the results are measured.
Compare your answer with the correct one above